
If you want to be a data analyst professional or someone who needs to deal with data, you should be good at handeling the dataset. Analysis data in python is the easiest and most popular thing now. If you are a beginner or someones wants to learn about data cleannig in python, you are in the right place. In this blog I will explain the basic steps of data cleaning with a raw dataset.
The Messy Data
Almost 95% of the data available in the market have flaws. If you want to analyse a data set that generates value, you need a cleaned dataset. Directly jumping towards analysis bring wrong conclusions. This will not only affects your organization but also your own career. As an enthuastic person you downloaded the data set and started analysing it. But here’s the take. What if I tell you that you are in the wrong direction. Analysing the raw data set without checking it, does’nt have industry value. Data cleaning is the necessary step before data analysis.
Data Cleaning
Now let’s jump into the main part. We will be learning with pratical dataset. Kaggle is one of the best platform to download and pratice data cleaning and analysis. So first we are going to download a raw data set. Here is the dataset link, you can download and pratice by yourself. I will be using jupyter notebook in VS code.
Loading The File
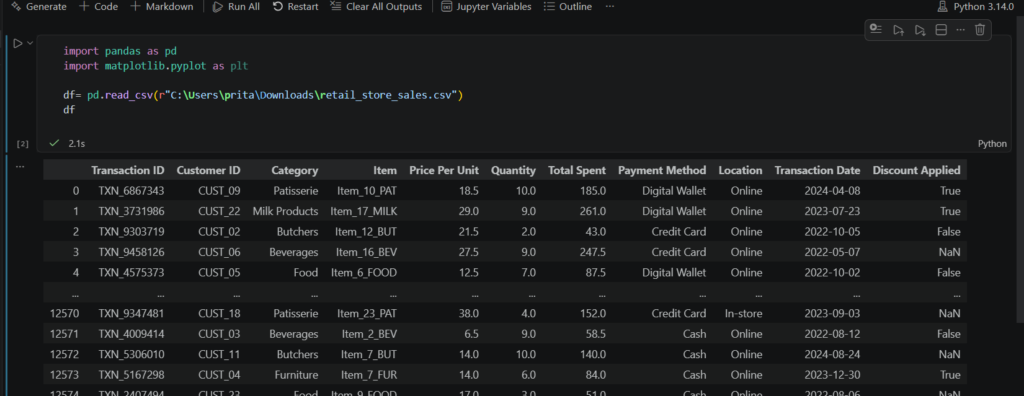
After downloading the csv file, open VS code and create new file in jupyter notebook. Now first you need to import some python libraries (pandas, matplotlib) to clean your data. You need to run these codes below

Then you need to load the csv file which you have downloaded from Kaggle. Go to your file explorer where the file is located then right click on the file. There you need to scroll down and find the option of copy as path. Click on it, file path will be copied. After that return to your notebook. Then we will store the data in dataframe(df). Run this code df= pd.read_csv(“paste your file path”), now just put a small r just before your file path between the first brackates df= pd.read_csv(r”paste your file path”). Then write df and press enter. This will show you the elements in the dataset including rows and columns. You will have an glimpse of the data set.
Inspect The Dataset
Now this is the portion where you will get an overall insights of the dataset.
df.shape – this will provide you the exact number of rows and columns of the data set (rows x columns). After that we need to know whether tha data has null values or not ? What are the data types. For that we need o run the code df.info( )
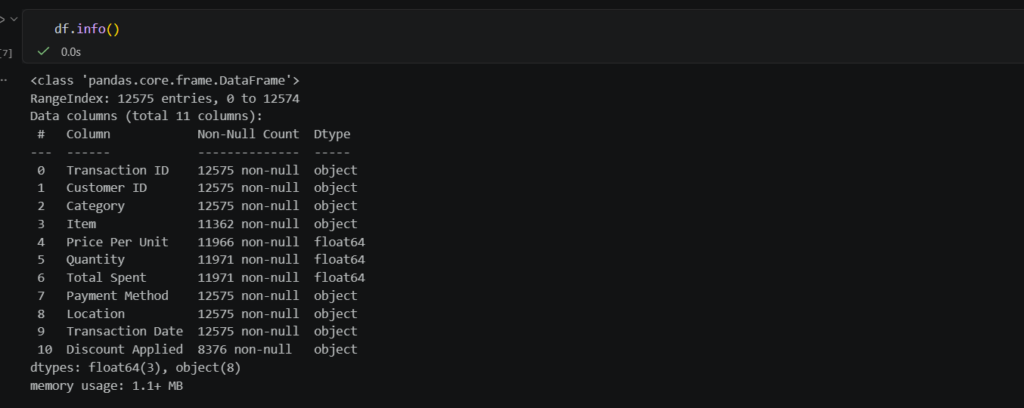
Now you can see all the columns , non null counts and data type(Dtype). When you checked the number of rows and columns, it will show 12575×11. There are 12575 rows in the dataset. But in some columns there is less value than that. Let’s look at the item column, non null count supposed to be 12575 but it’s 11362 non null values that means 1213 null values(empty). Alos Price Per Unit, Quantity, Total Spent and Discount Applied has the same characteristic. Now look at the data type column. There you can see two types of data are there object and float64. “object” refers that data is in text format. “float64” refers to numerical data with decimals(Ex:- 87.88, 11.03). Do have have noticed one thing here ? Transaction date is in object type. For that we need to run df[‘Transaction Date’] = pd.to_datetime(df[‘Transaction Date’]). This will fix the data type into datetime [ns]. If you further wants to do yearly data analysis then you need to extract the year from the dates, run df[‘Year’]= df[‘Transaction Date’].dt.year
Dealing With Null Values
Now we are going to find the all null values from the dataset. Run this code df.isnull( ).sum( ), This will show the exact number of null values for particular columns.
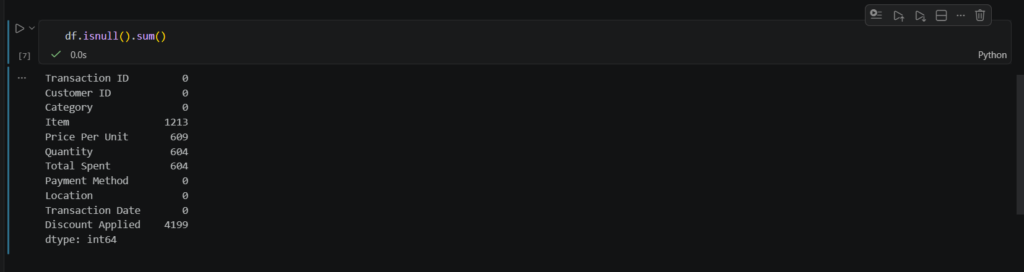
Here we can see the exact number of null values in each column. Now in two ways we need deal with these null values by removing or replacing
We need to be carefull while removing the data. Suppose One column has 1000 data and the null values are only 100. In this case only 10% of the data set is creating problems. If data set have less than 5% of null values then the possibilites of removing the null values is justified. But for most of the cases it is advised to replace the null values with mean or median values. df=df.dropna( )– this will remove every rows with null values. df.dropna(how=’all’)– it removes fully empty rows. Now to replace the null values with mean or median we need to run these codes df[‘Quantity’]= df[‘Quantity’].fillna(df[‘Quantity’].mean()) or df[‘Quantity’]= df[‘Quantity’].fillna(df[‘Quantity’].median()).
Checking The Duplicate Values
df.duplicated( ).sum( )– run this code to check the duplicate values. You will find that this dataset does’nt has any duplicate values. But incase if you found any in other dataset run df_clean= df.drop_duplicates() for any specefic column run df_unique = df.drop_duplicates(subset=[‘Column Name’])
Add or Remove Columns
Now if you find any unnecessary columns that is not needed during your analysis. Then run df.drop([‘Column1’, ‘Column2’], axis=1, inplace=true). Suppose you want to know he revenue for further analysis for that you need to add this column. Run df[‘Revenue]= df[‘Price per unit’] * df[‘Quantity’], in this way you can add any columns with formula.
Save Your File
df.to_csv(‘File path name’, index=false). Always remember to save your file, either everything you have done, wouldn’t save. So his was the simplest way to do data cleaning in python. It’s builds upon the basics you need to know for data cleaning. Let me know in the comments how would you rate this blog. I would love to hear your opnions.